CTA ETFs and Landman: What the Hit TV Series Can Teach Us About the Price of Oil During Periods of Market Volatility
By Mount Lucas
This blog post originally appeared on the Mt. Lucas Insights page and explores how oil price dynamics can illustrate the broader role that managed futures strategies play in a portfolio. Throughout the article, Mt. Lucas uses the term Commodity Trading Advisors (CTAs), an industry-standard term that is interchangeable with managed futures. Mt. Lucas is the subadvisor for our managed futures ETF, the KraneShares Mount Lucas Managed Futures Index Strategy ETF (Ticker: KMLM).
The mark of great writing is encapsulating the essence of a complicated idea in a memorable and accessible way. As Mt. Lucas framed it in their post, "it's more than a little humbling that the scene embedded below, from Landman, does a better job in a little over 20 seconds than our previous 90 blog posts and 8 whitepapers in explaining futures markets, economic risk, and (with some poetic license) our approach to portfolio construction and CTAs.” In the show, Tommy Norris is a Texas oil fixer and explains oil pricing like this:
“You want oil to live above 60 but below 90. And don’t get me wrong, we’re still printing money at 90, but… gas gets up over $3.50 a gallon, it starts to pinch. It hits a hundred, every product in America has to readjust its price. $78 a barrel, that’s about perfect. You know, brings enough profit to keep exploring, but it don’t sting as much at the pump.”
CTA strategies live and breathe this, in oil and many other commercial markets, participating on the upside through long positions as prices rise, and on the downside through shorts as they fall. The start of 2007 saw oil prices right around $60 a barrel; by the end of the year, they were north of Norris’s $90 line in the sand; by mid-2008, they were $140. The Global Financial Crisis (GFC) had many causes, but it sure wasn’t helped by rising gas prices squeezing household finances. A few months before Lehman failed and things went really off the rails, Federal Open Market Committee (FOMC) meetings were dominated by inflation and oil fears, and the European Central Bank (ECB) even hiked rates. As the world fell apart through late 2008 and into 2009, oil collapsed, falling some 75% to $35 a barrel, well below the $60 marker.
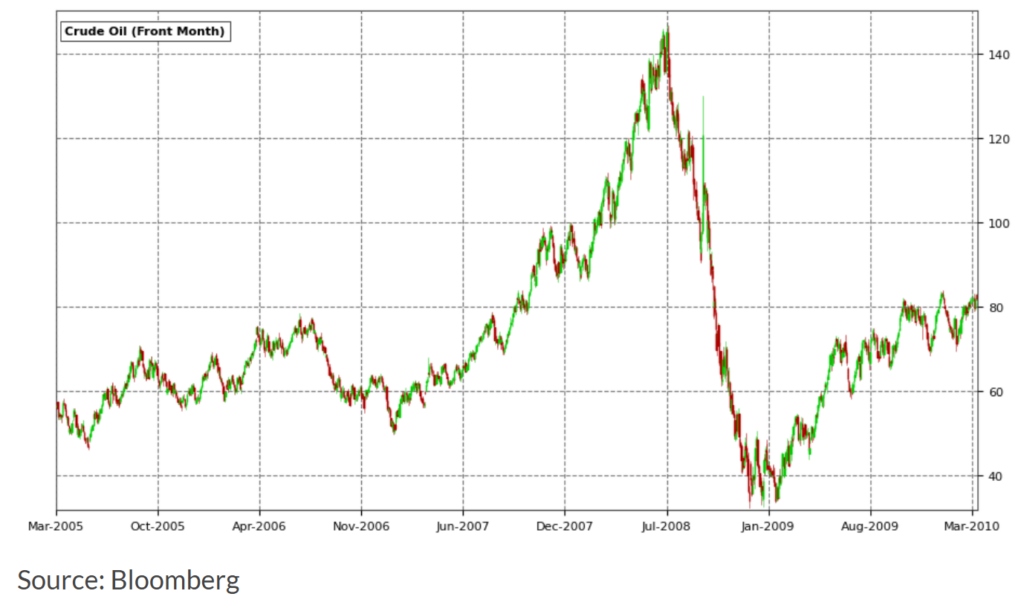
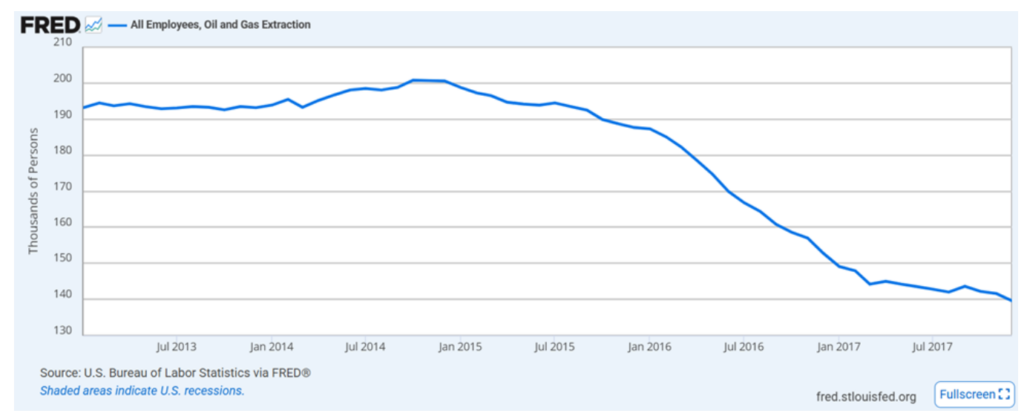
Fast forward a few years to 2014, prices had recovered and were floating around $90, until they dropped out of the golden range pretty abruptly and averaged $45 for 2015-2016.1 To paraphrase Norris, $45 isn’t enough profit to keep exploring. US oil and gas extraction jobs dropped by a third.
What’s that got to do with futures markets, CTAs, and portfolio construction? Eventually, these things self-correct. The best medium-term cure for high prices is high prices, same in reverse. Futures markets facilitate price discovery — pricing and incentivizing demand reduction in the near term, shifting inventory into the present through the forward curve, and allowing producers to lock in longer-term higher prices as the long-dated curve shifts higher. Locking in higher prices gives producers certainty about project revenue, enabling them to expand into production that was uneconomic at lower prices. This hedging risk premium is a two-sided market; it needs participants on both the long and the short sides. In the mid-1980s, Mt Lucas created the MLM Index to capture this risk premium and argued that case portfolios should be exposed to it as a diversifier.* The KraneShares Mount Lucas Managed Futures Index Strategy ETF (Ticker: KMLM) tracks the KFA MLM Index, bringing that same systematic approach to a liquid, accessible ETF structure available to investors.
Right now, traditional diversifiers aren’t helping much.* Bonds are dropping. Gold is behaving like a risk asset, and the new toy, bitcoin, is near its year-to-date lows.2 Investors should have some exposure to the CTA premium, as it is typically uncorrelated with traditional stocks and bonds and, historically, has been moderately negatively correlated during crisis periods. As Mt Lucas looks at oil prices in the current environment, they see this playing out again. The equity and bond markets are moving in lockstep with oil prices, with multiple contracts and yields shifting upward as oil prices move, a textbook example of a Value at Risk (VaR) shock, where sharp market moves force investors to rapidly reduce exposure across asset classes simultaneously, driving correlations higher across the board, as Mt. Lucas recently wrote about.
Mt Lucas' approach is designed to generate maximal skew when the futures risk premium is expanding, as that is when you need it most in equity portfolios. This helps align with the equity market’s volatility during periods of stress. Oil volatility has recently jumped. Some CTA approaches reduce positions into that volatility. Mt Lucas sticks with it. While it is impossible to know exactly how the Middle East tensions will play out, the resulting market volatility has so far proven to be an effective test case for the potential diversification benefits of KMLM.*
*Diversification does not ensure a profit or guarantee against a loss.
For KMLM standard performance, top 10 holdings, risks, and other fund information, please click here.
Citations:
- US Energy Information Administration (EIA), "Petroleum & Other Liquids: Crude Oil Prices," January 2017.
- Data from Bloomberg as of 3/20/26.
Definitions:
- MLM Index: Introduced by Mount Lucas Management in 1988 as the first passive index of returns to futures investing, the MLM Index provides pure systematic trend-following exposure across commodity, currency, and global fixed-income futures, designed to capture the price risk premium sought by those who seek price certainty.
- KFA MLM Index ("KMLM's Index"): The KFA MLM Index is a diversified trend-following portfolio of commodity, currency, and global fixed income futures contracts traded on US and foreign exchanges. The performance data for the index is a representation of the MLM Index from 1/1/1988 to 12/31/2004, the MLM Index EV ("EV"), with enhanced Execution and Volatility characteristics, from 1/1/2005 to 11/30/2020, and, using the same methodology as the "EV," the KFA MLM Index from 12/1/2020 on.
- Skew: A measure of the asymmetry of an investment's return distribution. Positive skew describes a return profile with frequent small losses and occasional large gains, while negative skew describes the opposite, frequent small gains with the potential for large, sudden losses.