KMLM Managed Futures ETF Q1 2026 Review: Crisis, Commodities, and the Case for Trend-Following
By Mount Lucas
Q1 was certainly volatile, dominated by events in the Middle East. Oil prices shot up, equity markets tumbled, and bonds sold off on inflationary fears. 2022 all over again. We have long maintained that trend-following exposures, particularly those tilted toward commodity markets that don't cut positions when the macro gets a little unglued, can offer a robust alternative to other safe-haven choices. Through this most acute period of stress, bonds and gold both fell, while trend did well, highlighting the ability to be negatively correlated in stress periods and having exposure directly to the macro areas stocks worry about. Added bonus points for the liquidity at transparent exchange pricing that allows timely rebalancing, particularly relative to the troubles in the private equity and credit space that are continuing.
Q1 Index and Sector Performance
The KraneShares Mount Lucas Managed Futures Index Strategy ETF (Ticker: KMLM) seeks to track Mount Lucas Management's KFA MLM Index. The Index finished the quarter up 8.3%. Commodity (+9.2%) and Currency (-0.1%) markets contributed to results while Global Fixed Income (-1.9%) markets detracted. Interest income added 100bps. For the twelve months ending March 2026, the Index was up 9.3%. Year to date, the Index is up 8.1%.
Q1 Index and Sector Exposures
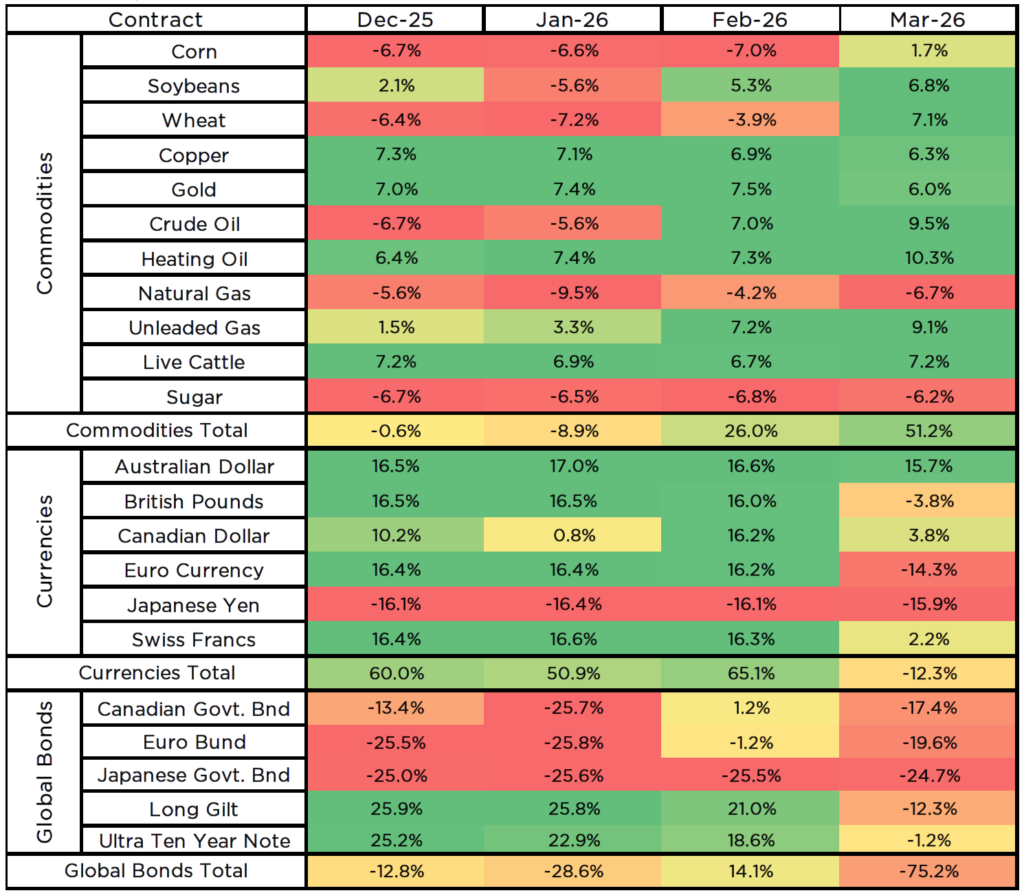
Over the course of the quarter, Commodity exposures went from net short 1% to net long 51%, Currency exposures went from net long 60% to net short 12%, and Global Fixed Income exposures went from net short 13% to net short 75%.
Q1 Review
To be sure, some of the 2022 comparisons rhyme, and on the physical oil side, are notably worse. We are seeing both a rapid reduction in available oil supply and the physical destruction of production capacity. The scale of potential disruption through the Straits of Hormuz, if sustained for months, would be catastrophic. The world consumes roughly 100 million barrels per day, with about 20% flowing from the region, and that simply cannot continue for an extended period. The workarounds currently in place are helping with a reasonable portion of the shortfall, including rerouting oil through pipelines, Strategic Petroleum Reserve (SPR) releases, sanctions relief, increased U.S. production, and relatively high starting inventories, but if the disruption persists, price will ration demand, and that won't be pretty. Such an outcome would likely spill over into other markets. Hopefully it doesn't come to that.
The differences versus 2022 are significant, particularly for yields. Starting rates this time are meaningfully restrictive, well removed from the near-zero levels of that period. The economy back then was also being supported by pandemic-era, stimulus-driven demand colliding with the rolling bullwhip of staggered reopening and supply chain bottlenecks. Hiking rates in that environment made sense. Markets flirting with rate hikes in the current supply shock, with the economy already slowing, seems misguided — the Bank of England can hike, but it won't do much to rebuild natural gas infrastructure 3,000 miles away.
In the commodity sector, the top three contributors were Heating Oil, Unleaded Gas, and Crude Oil, while the bottom three detractors were Wheat, Sugar, and Soybeans. In grains, prices rallied during the quarter, front-running some of the 2022 trades that worked, as higher energy prices feed into grain costs, particularly through Natural Gas, which is essential for fertilizer production. Index positioning moved long during the quarter. In metals, Gold sold off aggressively at the onset of the Iran war, trading more like a risk asset than a defensive one, but still finished the quarter in positive territory. Copper also declined as war fears pushed growth expectations lower. In the energy sector, the oil complex finished sharply higher across the board, with Index long positions benefiting. Natural Gas finished lower, helping the Index's short position. In agriculture, Live Cattle trended higher, and Sugar staged a sharp rally into quarter-end from recent lows. Major shifts in exposure during the quarter included Corn (short to long), Crude Oil (short to long), Unleaded Gas (increased long), Soybeans (increased long), and Wheat (short to long).
In the currency sector, the Australian Dollar and Japanese Yen were the primary contributors, while the remaining currencies were all modest detractors. Weaponization of the Dollar, tariffs, rising gold prices, and pressure on the Fed to lower rates had collectively driven Dollar weakness over recent quarters, with the Index building long foreign currency exposures. That sentiment shifted quickly at the onset of the war, with the Dollar strengthening and foreign currencies weakening. Notably, the Japanese Yen was the only market that never went long, its negative trend remaining intact. Major exposure shifts during the quarter occurred in the British Pound (long to short), Canadian Dollar (reduced long), Euro Currency (long to short), and Swiss Franc (reduced long).
In the global fixed income sector, the only contributor was the Japanese Government Bond (JGB), while UK Long Gilts, Canadian Government Bonds (CGB), the Euro Bund, and the U.S. Ten-Year were all detractors. The Index began the quarter with a small net short bond exposure that built to a small net long by the end of February. As the war escalated, energy prices surged, taking inflation expectations with them. Front-running 2022 dynamics once more, bonds fell rapidly, and Index positioning adjusted, ending the quarter meaningfully short. Major shifts in exposure included the CGB (increased short), UK Long Gilt (long to short), and U.S. Ten-Year (long to small short).
Net Market Exposures
Holdings are subject to change.
For KMLM standard performance, top 10 holdings, risks, and other fund information, please click here.
Index returns are for illustrative purposes only and do not represent actual Fund performance. Index returns do not reflect management fees, transaction costs, or expenses. Indexes are unmanaged, and one cannot invest directly in an index. Past performance does not guarantee future results.
Term Definitions:
BPS: Basis points, a unit equal to 0.01% used to measure changes in interest rates or other financial percentages.
SPR: the U.S. government's emergency crude oil stockpile stored in underground salt caverns along the Gulf Coast, used to stabilize energy markets during supply disruptions.
Net Long/Short Exposure: A futures contract is an agreement to buy (long) or sell (short) an asset at a predetermined price at a specified future date. The exposure is calculated by the position size (negative if short) times the value of one contract.