The AI Power Boom: Investing Through Carbon Markets
By  Luke Oliver, Managing Director and Head of Strategy &
 Megan Gummer
How growing electricity demand is creating a new investment driver across global compliance carbon markets
AI is driving one of the largest increases in electricity demand in decades. The International Energy Agency (IEA) projects global data center electricity consumption will nearly double, from 485 terawatt-hours (TWh) in 2025 to 950 TWh in 2030, with AI-focused demand roughly tripling.1 As data centers multiply, power is becoming one of the defining economic consequences of AI adoption.
Capturing that growth through a differentiated exposure is not straightforward. Many of the most compelling AI names remain private, while publicly traded companies often carry high valuations and are already heavily represented in broad equity portfolios. Meanwhile, electricity is difficult to invest in directly, and energy commodities carry storage and seasonality costs, meaning a compelling long-term electricity-demand thesis does not necessarily translate into a practical investment.
Compliance carbon allowances offer an alternative way to access this trend by targeting another measurable consequence of AI’s power demand: emissions from electricity generation. At the current pace of growth, AI data centers in the US could emit as much carbon dioxide each year as 5 to 10 million passenger cars through the end of this decade.2 In regions that regulate emissions under cap-and-invest programs — including the EU, California, participating Eastern US states, and Washington state — incremental electricity demand that is met by additional fossil-fuel generation could drive an increase in compliance demand for carbon allowances.
How AI’s Power Demand Reinforces Carbon’s Supply-Driven Investment Case
The investment case rests on two powerful forces converging: policy-driven reductions in allowance supply, as governments progressively tighten emissions caps, and a potential new source of compliance demand from AI's growing power needs. We believe this combination gives investors something AI equities cannot. It offers exposure to the AI build-out without identifying the winning model developer, chipmaker, hyperscaler, or data center operator, alongside a second, independent driver in legislated supply reductions. And where new demand meets a market whose surplus is already shrinking, even modest additions may tighten balances meaningfully.
Figure 1: How AI-driven electricity demand can increase compliance carbon allowance demand

Virginia: A Real-World Case Study
Virginia provides a tangible example of how the AI power boom can intersect with compliance carbon markets. Home to one of the world’s largest concentrations of data centers, the state faces rapidly growing electricity requirements just as its power sector has re-entered the Regional Greenhouse Gas Initiative (RGGI). The program requires covered fossil-fuel power generators with 25 megawatts (MW) or more capacity across participating Eastern US states to surrender allowances against their emissions.
The scale of Virginia's data center industry makes this connection particularly relevant. Data centers accounted for approximately 28% of Dominion Energy Virginia’s electricity sales in 2025,3 with roughly 700 facilities operating or in the pipeline concentrated in Northern Virginia’s “Data Center Alley."4 The state's lead reflects its fiber and subsea cable infrastructure, historically competitive power prices, tax incentives, and proximity to federal agencies.
Expectations surrounding Virginia's return to RGGI contributed to a sharp repricing, as participants weighed the state's substantial power-sector emissions and growing electricity needs against tightening market supply. Following the official April 24 announcement on Virginia's re-entry into the program, RGGI allowance prices nearly doubled from the start of the year, reaching a record high of approximately $52 in early May. Although prices have eased from their peak, RGGI allowances remain up 51% year-to-date as of October 26, 2026, trading around $40 per short ton.5
Figure 2: RGGI allowance price performance following Virginia's re-entry announcement

Beyond the initial repricing, the longer-term question is how Virginia’s additional electricity demand will be met. Resources for the Future’s (RFF) June 2026 analysis assumes in-state natural-gas generation supplies 80% of overall load growth, with the remainder from zero-carbon or non-RGGI sources.6Applying that assumption, along with two lower illustrative scenarios, a hypothetical 20 TWh increase in data center demand would require roughly 2.6 million to 7.1 million additional RGGI allowances a year.7
Figure 3: Illustrative additional annual RGGI allowance demand under data center load-growth scenarios

The supply outlook puts these figures into perspective. From 2027, RGGI’s new cap trajectory declines by about 11 million short tons a year through 2033, nearly four times the previous rate.8 Together with Virginia's return, this is projected to reduce RGGI’s bank of surplus allowances to about 20 million short tons by the end of 2030, from 35 million previously.9 While the expanded reserve may provide some near-term supply flexibility, the steeper cap could become a more significant price driver as the allowance surplus declines. This matters because the price impact of new demand depends on how much of a supply buffer the market has. Where a large surplus exists, incremental emissions can be absorbed. Where it is nearly exhausted, and caps are falling, even modest increases in demand may have an outsized effect on prices.
Virginia illustrates how accelerating electricity demand can create additional compliance demand for carbon allowances at a time when regulatory policy is constraining supply.
Beyond Virginia: A Broader Opportunity Across Global Carbon Markets
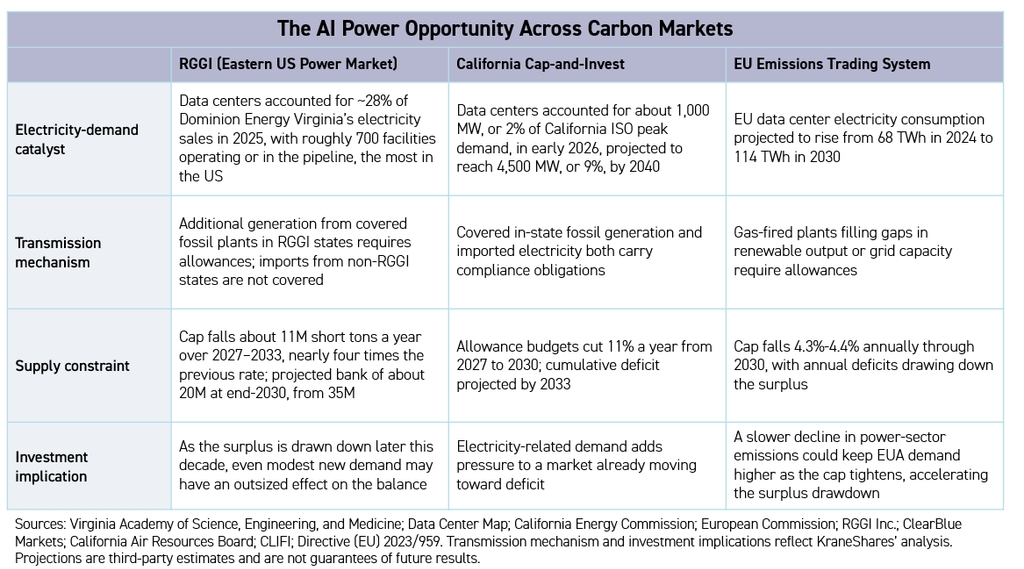
The opportunity extends beyond RGGI to California and the EU, where rising electricity demand also meets tightening allowance supply. Differences in generation mix and regulation create distinct market effects, diversifying exposure across established carbon programs rather than concentrating it in one region.
Powering Data Centers with Existing Gas Infrastructure: California Spotlight
California's Cap-and-Invest program offers another important expression of the same theme. Data centers accounted for about 1,000 MW, or 2% of California Independent System Operator (CAISO)'s peak electricity demand, in early 2026, a figure projected to rise to 4,500 MW, or 9%, by 2040.10 Unlike RGGI, California’s program extends beyond in-state power generation to cover emissions associated with imported electricity, alongside fuel distributors and large industrial facilities. As data center demand grows, any incremental emissions from covered in-state generation or electricity imports could add to compliance demand for California Carbon Allowances (CCAs).
The proposed 275 MW Golden Valley Technology Hub in Kern County illustrates one potential pathway: developed by Beacon Data Centers and California Resources Corporation, the campus would draw power from the existing compliance-regulated 550 MW Elk Hills gas plant. To the extent that serving the campus requires additional gas generation, the resulting emissions could increase demand for CCAs.
This potential demand-side growth comes as supply tightens sharply. Reforms adopted in May 2026 cut allowance budgets by 11% a year from 2027 to 2030, up from about 4%, helping push the market into cumulative deficit by 2033.11 CCA prices are currently trading at $32 as of October 26, 2026, just $2 above the projected 2027 auction reserve price.12 The reserve price sets a minimum price at government auctions and increases annually by 5% plus inflation, providing a rising downside benchmark for the market.
Europe's Rising Power Demand Meets Grid Constraints
Europe provides a further example. Data center electricity consumption across the EU is projected to rise 68%, from 68 TWh in 2024 to 114 TWh by 2030,13 as the EU targets a tripling of data center capacity within the next five to seven years.14 This material increase in energy demand adds pressure to electricity systems already navigating renewable-energy deployment, transmission constraints, and the retirement of conventional generation. Additional demand may require continued gas-fired generation where renewable output and grid capacity fall short.
For the EU Emissions Trading System (EU ETS), the key investment implication may be less about an increase in absolute emissions and more about a slower pace of decarbonization. This dynamic was evident in the first half of 2026, when EU power-sector emissions rose 2% year-on-year despite record wind and solar output, as gas generation increased.15 While the increase was not attributed specifically to data centers, it illustrates continued reliance on fossil generation when clean supply falls short. Additional AI-related demand could similarly slow the decline in covered power-sector emissions, sustaining demand for EU Allowances (EUAs) as the cap continues to tighten, falling 4.3% a year through 2027 and 4.4% a year from 2028.16
Overall, the scale and structure of each market differ, but the mechanism is the same: growing electricity demand meets a tightening allowance supply.
Figure 4: AI-related electricity demand across major compliance carbon markets
Accessing the Opportunity: The Portfolio Case
Investors can put this thesis into practice through KraneShares' carbon ETF suite, including the Global Carbon Credit ETF (KRBN) for diversified exposure across major compliance carbon markets and the California Carbon Credit ETF (KCCA) for targeted California exposure. Beyond the potential AI-related demand catalyst, the portfolio appeal lies in carbon’s distinct return drivers.
Allowance prices are shaped by legislated supply caps, compliance demand and covered emissions. While broader economic and energy-market conditions also play a role, these drivers differ from those that typically influence corporate earnings, technology valuations and physical energy commodities. And now, the established carbon supply-driven thesis is being supplemented by a potentially significant new source of demand.
Collectively, these distinct drivers have contributed to differentiated portfolio characteristics. Carbon allowances* have historically provided competitive returns with low correlation to major asset classes, including a monthly correlation of 0.31 to the S&P 500 from August 2014 to September 2026. Distinct program structures and market drivers have also kept correlations between individual carbon markets low, adding another layer of diversification and sources of return (see “Correlations across carbon markets" table at the end).† Unlike fuel commodities, carbon allowances require no physical storage and are less affected by seasonal pricing. Futures-based exposure carries costs associated with replacing expiring futures contracts with later-dated contracts, but these largely reflect financing costs. These characteristics support the case for carbon as an accessible way to gain exposure to structural shifts in energy demand without navigating some of the potential shortfalls and complexities of equities and traditional commodity markets.
Figure 5: Historical return and correlation characteristics of carbon allowances

A Differentiated Way to Invest in the AI Power Boom
The extraordinary growth in electricity demand is creating investment opportunities that extend well beyond traditional AI equities. Yet capturing this theme through technology stocks can mean paying elevated valuations and adding to already concentrated portfolio exposures, while investing directly in electricity or conventional energy commodities presents its own practical and economic challenges.
Compliance carbon allowances offer a compelling alternative. They provide exposure to a fundamental economic consequence of the AI build-out: the emissions associated with meeting rising electricity demand. As that demand potentially sustains or increases covered emissions, it creates an additional source of allowance demand precisely when governments are systematically constraining supply. Virginia demonstrates this mechanism in practice, while California and Europe illustrate its potential across broader, established carbon markets.
For investors looking to capitalize on the AI power boom without simply adding more expensive technology exposure, carbon allowances deserve a closer look. KraneShares offers multiple ways to explore this opportunity, including diversified exposure through KRBN, targeted California exposure through KCCA, and European and UK listings and private offerings for qualified investors.
†Diversification does not ensure a profit or guarantee against a loss. Correlations may change over time.
- IEA, “Key Questions on Energy and AI: Executive Summary,” April 16, 2026.
- Cornell Chronicle, “‘Roadmap’ shows the environmental impact of AI data center boom,” November 10, 2025.
- Virginia Academy of Science, Engineering, and Medicine, Electric Power in Virginia: The Essentials for Decision-Makers, July 2026.
- Data Center Map, retrieved 10/22/2026.
- Data from Bloomberg as of 10/26/2026.
- Resources for the Future, “Affordability Data Tool: Explore Virginia’s Re-entry into the Regional Greenhouse Gas Initiative,” June 22, 2026.
- Calculation: RGGI allowances (millions) = additional annual load (TWh) × covered-generation share × 0.441 short tons of CO2 per MWh.
- RGGI Inc. Program Review, retrieved 10/27/2026.
- ClearBlue Markets, “RGGI Model,” retrieved 10/27/2026.
- California Energy Commission, “Data Centers,” retrieved 10/22/2026.
- International Carbon Action Partnership, “California Air Resources Board adopts regulatory updates to the Cap-and-Invest Program,” June 8, 2026. 2033 Deficit projection sourced from Veyt and Climate Finance Partners.
- Data from Bloomberg as of 10/27/2026.
- European Commission, “REPORT FROM THE COMMISSION TO THE EUROPEAN PARLIAMENT AND THE COUNCIL on the energy efficiency of data centres in the EU,” September 21, 2026.
- European Commission, “Making data centres energy efficient thanks to a new EU rating system,” September 21, 2026.
- Center for Research on Energy and Clean Air, “EU CO2 emissions fell 2% in first half of 2026, just under half the pace needed to meet the EU’s 2030 climate target,” September 30, 2026.
- European Commission, “EU ETS emissions cap,” December 11, 2025
Index & Term Definitions:
- S&P 500 Index (Price Return): Standard & Poor's Index is a capitalization-weighted index of 500 stocks.
- Bloomberg US Aggregate Bond Index (Total Return, Unhedged USD): A broad base, market capitalization-weighted bond market index representing intermediate term investment grade bonds traded in the United States. Inception date: January 1, 1986
- S&P GSCI (Spot): A composite index of commodities that measures the performance of the commodity market. Inception date: May 7, 2007
- MSCI US REIT Index (Price Return): A free float-adjusted market capitalization weighted index that is comprised of equity Real Estate Investment Trusts (REITs). Inception date: June 20, 2005
- LBMA Gold Price PM (Spot): The global benchmark price for unallocated gold delivered, IBA operates electronic auctions for spot, unallocated loco London gold.
- S&P GSCI Crude Oil Index (Excess Return): Provides a publicly available benchmark for investment performance in the crude oil market. Inception date: May 1, 1991
- *Carbon allowances: Top 5 carbon allowance markets by constituent trade volume. The S&P Global Carbon Credit Index (Excess Return) is used since the index start date July 25, 2019. From 11/30/2016 to prior to the index start date, 60% and 5% were respectively assigned to EUA futures prices (current year and next year December vintages) using Intercontinental Exchange daily published settlement prices, 20% and 5% were respectively assigned to CCA futures (current year and next year December vintages) using IHS Markit OPIS's daily Carbon Market Report published prices, and 10% was assigned to RGGI (current year December vintage) using IHS Markit OPIS's daily Carbon Market Report published prices. Prior to 11/30/2016, 60% and 5% respectively were assigned to EUA futures prices (current year and next year December vintages) using Intercontinental Exchange daily published settlement prices and 35% was respectively assigned to CCA futures (current year December vintage) using IHS Markit OPIS's daily Carbon Market Report published prices. For the two ranges developed prior to the index start date, Intercontinental Exchange and IHS Markit OPIS's Daily Carbon Market Report publish daily pricing for each contract vintage for all relevant days when the futures trade.
- Sharpe ratio: Used to help investors understand the return of an investment compared to its risk. Generally, the greater the value of the Sharpe ratio, the more attractive the risk-adjusted return.
- Correlations across carbon markets: