California Carbon’s Pivotal Investment Window Ahead of Market Reform
From Hollywood to Silicon Valley, California is a powerhouse that commands global influence. The carbon markets are no exception. Though the California carbon cap-and-trade program is often viewed as the younger sibling to the larger, more established European Union Emissions Trading System (ETS), California has emerged as a force in its own right. CCAs have seen a 15.8% annualized price increase from 2019 to 2023, which lags their European counterpart’s 23.3% return over the same period.1 At the same time, the younger California carbon market is approaching a key inflection point that occurs in a cap-and-trade program's lifecycle where, by design, demand begins to outpace supply. When this happens, California may be poised to break away from its peers.
There are several structural features that distinguish the California carbon markets from Europe. The California ETS includes broader emissions coverage than the EU ETS, including suppliers of transportation fuels and large-scale industrial facilities. California also has innovative price management mechanisms that set a floor price with an annual 5% plus inflation increase. Investors are drawn to this market for its inflation-hedging potential, equity-like return profile, and low correlation to traditional stocks and bonds.
While California carbon is amassing positive momentum, the markets hit a speed bump in 2024, which may create a compelling entry point. Beginning in June this year, CCAs experienced a pullback, moving from $42 to $36 by the end of September.2 This price action was largely driven by uncertainty over the timing and scope of upcoming market reforms.
Every few years, the California Air Resources Board (CARB), which is the agency in charge of regulating the market, reassesses the program to ensure it is on track to meet the state's emissions reduction targets. CARB serves a similar role to that of the Federal Reserve, adjusting the supply of allowances in the market to safeguard prices against large swings. Unlike the FED, CARB has the additional directive of maintaining upward price pressure to ensure the program is driving the state's emissions reduction goals. Carbon traders are also very tuned in to CARB's regulatory updates in the same way that investors and economists follow interest rate policy changes and announcements. And just as uncertainty around interest rates causes market volatility, lack of clarity and delays to the reform process impact sentiment in the carbon markets.
We have seen this play out in California's market in recent months, where delays to updates on the reform have weighed on CCA prices. Most of the CARB's public workshops held over the past year (i.e., a forum where they cover various topics and progress on the reform) left out key topics of interest, such as the adjustments to the annual cap trajectory that defines the rate of allowance supply reductions. When CARB finally addressed these priority areas during their most recent July workshop, they unexpectedly announced that the reform implementation could be delayed by a year (2026 start vs the anticipated 2025) as they wanted to take additional time to fine-tune the full package. Market participants placed more focus on the shifted timeline rather than the supportive policy announcements, including cap-reduction options that significantly tighten the market supply by 20-26% over the 2026-2035 period.3
What does all of this mean for the CCA market?
Taking a step back first, its important to understand the basic fundamentals of how carbon cap-and-trade programs work. These are government-mandated and regulated programs designed to create a price on carbon. Compliance entities mandated under these programs typically fall under high-emitting industries such as industrial facilities, electricity generators and importers, natural gas suppliers, and transportation fuel suppliers. Depending on the specific market or trading system, carbon allowances are either provided to regulated entities free of charge (i.e., free allowances), purchased at auctions, or bought from other entities that have excess. Cap-and-trade, therefore, encourages regulated companies to find the most cost-effective strategies for their business while accelerating innovation and larger-scale adoption of clean tech within the overall industry.
The market's supply and demand dynamics determine the price, where the supply is controlled by the regulator (in this case, CARB) largely through the declining annual cap on emissions. The cap-and-trade lifecycle generally starts out with a surplus balance, or an excess supply of available carbon allowances, so that prices remain low and the regulated entities have time to ease into the program. However, over time, the regulator consistently takes out portions of the available allowances, which leads to supply scarcity that drives carbon prices higher and makes it less economical to pollute. In other words, the market regulators intentionally design and reform the market so that prices increase over time to stay on track to achieve their climate targets.
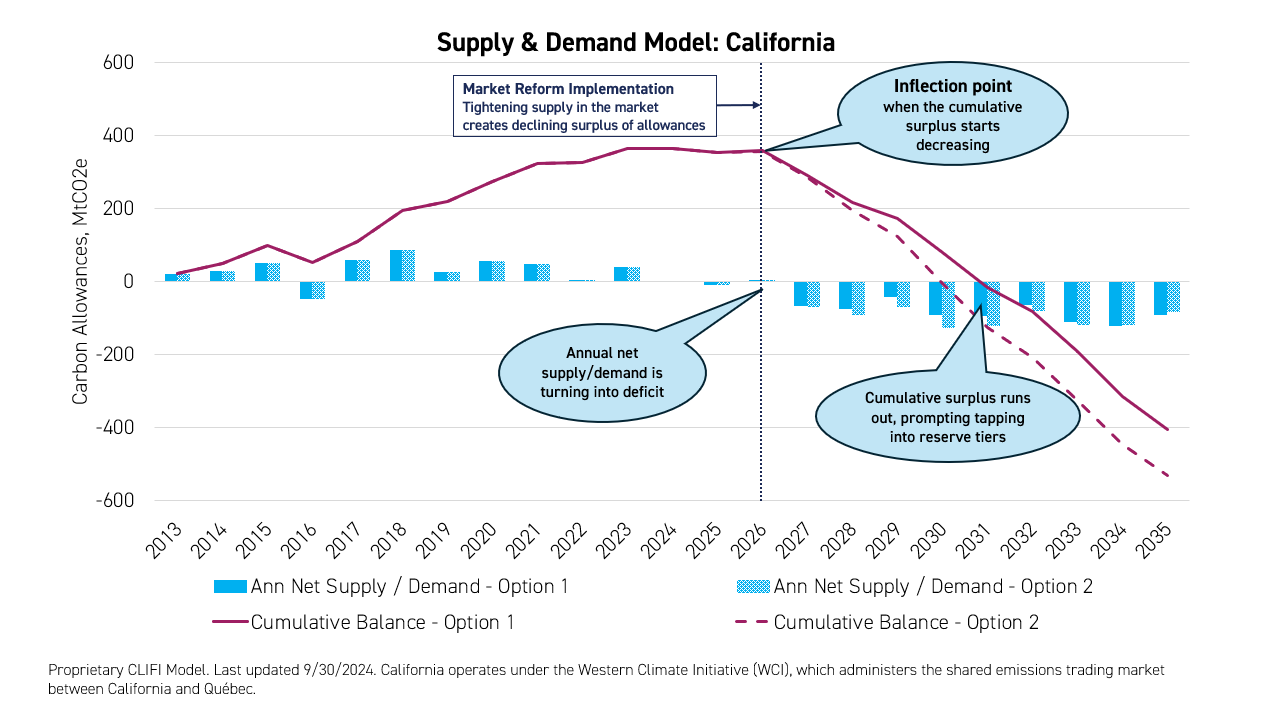
The key opportunity in these markets comes at the pivotal shift of the allowance surplus starting to decline and present annual net supply/demand deficits. California is currently approaching this inflection point—the critical moment in a cap-and-trade program's lifecycle—where its new reform policies help catalyze this transition and accelerate upward price pressure.

The diagram above illustrates the timeline of this shift, showing the cumulative surplus balance expected to hit the inflection point in 2026 after the introduction of the new reform's tighter caps, with a steep decline in the supply of allowances thereafter. The new policies adjust the annual cap by 10-14%, a significant increase from the existing rate of 4%. This results in the removal of at least 180-265 million tons of allowances directly from both auctions and free allocations of allowances over the 2026-2030 period.4
We expect the market to tap into cost-containment reserves (CCRs), which act as speed bumps to help stabilize the market and prevent prices from spiking too quickly by unlocking additional allowance reserves at two predefined tier price levels. The additional supply softens prices in the interim as the market has to first absorb the added allowances before prices can materially rise higher. If CCA prices rise above the Tier 1 level (set at $56.20 in 2024), a pool of new allowances will be introduced into the market supply, and if all of those allowances are used up, we will likely see prices rise to the Tier 2 at $72.21 and release an additional reserve of allowances into the market. Based on the current total CCR balance of 156Mt5 and the consistent annual net supply/demand deficits, these two tier reserves will likely be depleted in 2-3 years after the surplus is fully depleted in 2030-31.
Pushing above the reserves prompts prices to rise further to potentially hit the price ceiling projected to be over $134 in 2030,6 which aligns with CARB’s presented scenarios that "yield prices that follow the price ceiling through at least 2035."7 We anticipate the cumulative surplus to be fully depleted by around 2030-2031. In the regulator’s latest announcement on October 16, they stated intentions to potentially raise the CCR levels, which could include the floor price. If included, it would be supportive of the intrinsic valuation of CCAs as the floor provides some downside protection from an investment standpoint.

Why should investors care?
The key takeaway is that the opportunity in the California carbon market is happening now. Ahead of the policy reform, investors can capture this structural price appreciation as the regulator drives supply scarcity in the market. We also now have a much clearer picture of the reform proposals, unlike earlier this year when there was more policy uncertainty, exacerbating volatility in CCAs. We currently have a baseline picture of the amount of supply coming out of the market, where this supply is being removed from, and a timeline for when it is occurring. And, while the reform was delayed, the tightening is now accelerated under a shorter frame while providing the same end result.
CARB's "staff aims to make a formal rulemaking proposal available for public comment in the coming weeks," according to their latest announcement. We'll be keeping a close watch on this policy update. For further reading on additional potential policy risks, our recent report, California Cap-and-Trade: Navigating Real and Perceived Uncertainty, addresses local and federal political impact on the market. The full report can be found here.
How to capture the California carbon opportunity
Investors are already starting to make moves following the latest reform update. We are seeing renewed interest from speculators, where the trend has shifted to increasing long positioning among managed money in CCAs. CCA prices are still 17% below levels seen earlier this year, which neared $44 in February, and 250% below the modeled price expectation near the ceiling level of $134 for 2030.8 With the reform not fully priced and these favorable supply/demand fundamentals on the horizon, we believe there is a unique window to capture the California carbon market at strategic levels. Investors can access CCAs through the KraneShares California Carbon Allowance Strategy ETF (KCCA), which provides targeted exposure to the California carbon allowance futures.
For KCCA standard performance, top 10 holdings, risks, and other fund information, please click here.
- Data from Bloomberg as of 12/29/2023
- Data from Bloomberg 9/30/2024
- CLIFI, CARB as of 10/25/2024
- CARB, "Information Regarding Cap-and-Trade Regulation," Updates Issued October 15, 2024
- CARB, September 2024 Reserve Sales Notice
- Increasing 2024 levels of Tier 1, Tier 2, and ceiling price by 5% + IMF inflation forecasts as of April 2024
- CARB, "Joint California-Québec Workshop: Potential Amendments to the Cap-and-Trade Regulation," November 16, 2023, Combined Presentation, slides 34-35
- Data from Bloomberg as of 10/25/2024


