Vietnam ETF: 10 Stocks Investors Should Get To Know
Why Should Investors Consider A Vietnam ETF In Today's Market?
Vietnam was the fastest-growing economy among the members of the Association of Southeast Asian Nations (ASEAN) in 2025, achieving gross domestic product (GDP) growth of 8% year-over-year (YoY).1 If that was not quite enough to put Vietnam on the map for global investors, it achieved another milestone relevant for investors: planned inclusion in the FTSE Emerging Markets Index, with reclassification expected to take effect in September 2026, subject to FTSE Russell's implementation criteria. This represents an upgrade by the global index provider from frontier to emerging market status.
Strong growth combined with a recognition of its recent capital market reforms in the form of index inclusion mean that Vietnam's stock market has gained increased attention from global investors. But, with the vast majority of Vietnamese stocks listed locally and some are completely restricted from foreign investment at the individual stock level, Vietnam's stock market can be difficult to access. Even if one can access the market, stock selection can be a challenge for new investors because, as an emerging market, Vietnam's stock market lacks the breadth and depth of sectors seen in more developed stock markets, such as China's.
What are some of the benefits of Vietnam ETFs?
Vietnam ETFs can provide diversified exposure to Vietnam's stock market in a single investment that trades on a US exchange.* However, the KraneShares Dragon Capital Vietnam Growth Index ETF (Ticker: KPHO), through ownership of Dragon Capital's locally-listed product, the Diamond ETF, KPHO provides access to the stocks that reached or are nearing their Foreign Ownership Limits. KPHO also employs an index-based fundamental screen based on specified ranges of price-to-earnings (P/E) and asset-to-equity ratios, as well as a proprietary growth ratio calculated by the index provider, to select eligible securities.
What is the outlook for Vietnam's stock market?
As investors are looking to opportunities outside the United States and especially within emerging markets, amid a declining US dollar, Vietnam looks compelling. As of February 11, 2026, the average P/E ratio among KPHO's underlying holdings was only 9.7 compared to 17.2 for the MSCI Emerging Markets Index. At the same time, Dragon Capital, the fund's sub-advisor, expects net profit growth of 16% to 18% in 2026, which is in line with the MSCI Emerging Markets Index.2
What are KPHO's top 10 holdings and how do they contribute to Vietnam's growth story?
KPHO's current top 10 holdings span financial services, manufacturing, retail, technology, logistics, and real estate. These are all key components of Vietnam's current growth story, which is primarily driven by manufacturing for export, rising incomes and spending, and lending to support these development areas.
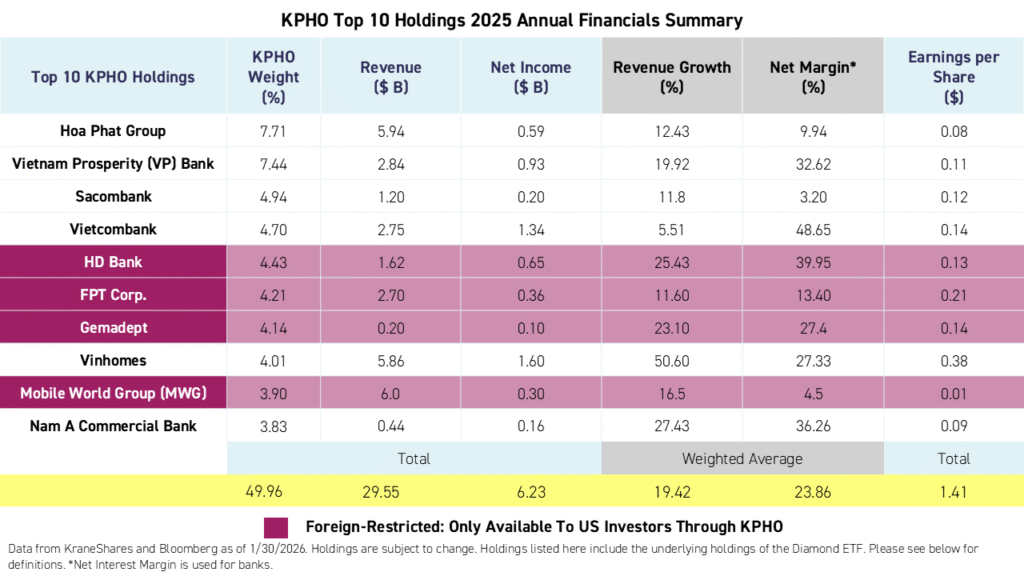
Below, we provide a brief description of each of KPHO's top ten holdings, accompanied by financial and operational highlights from 2025.
KPHO Top 10 Holding Profile & 2025 Earnings Update
Data from Dragon Capital, KraneShares, company releases & filings as of 12/31/2025. % changes are year-over-year (YoY) unless otherwise indicated. Figures may be adjusted (non-GAAP).
Hoa Phat Group

Hoa Phat is an industrial manufacturing group in Vietnam that started out as a construction machine and equipment trading company and gradually expanded its operations to include the production of steel, steel pipes, and agricultural products. It also supplies materials for infrastructure projects such as airports and high speed rail, which are important for Vietnam's current stage of development.
Hoa Phat Group By The Numbers (2025):
- Revenue +12.4% to $6.0 billion
- Net Income +28.5% to $0.6 billion
- Net Margin 9.9%
- Earnings per Share $0.04
Hoa Phat managed a solid earnings recovery in 2025, supported by higher steel volumes on improved domestic demand compared to 2024. Although fourth quarter net profit rose 38%, results were temporarily weighed down by approximately $34.2 million in depreciation and interest expenses following the early capitalization of a second blast furnace at a key steel plant. Steel continued to dominate revenues, accounting for 94% of fourth quarter sales. Despite short-term cost pressures, operating leverage improved as capacity utilization normalised throughout the year.
Vietnam Prosperity (VP) Bank

VP Bank is one of Vietnam’s largest private-sector banks by assets, operating a diversified platform across retail banking, corporate lending, consumer finance, securities, and insurance. The bank has continued to expand its scale and deepen its ecosystem, supported by a focus on digitalization and fee-based income alongside its core lending activities.
VP Bank by The Numbers (2025):
- Revenue +19.9% to $2.9 billion
- Net Income +52.0% to $0.9 billion
- Net Interest Margin 5.4%
- Earnings per Share $0.12
VP bank reported improved profitability in 2025. In the fourth quarter, profit before tax rose 43% and net profit rose 43% and net profit rose 72%, reflecting improved operating and bottom-line results. Overall lending growth in the consumer and corporate segments was 35% in the fourth quarter, driven by both the parent bank and improving contributions from subsidiaries FE Credit and VP Bank Securities. Asset quality improved as non-performing loans (NPLs) were reduced to nearly 3%. Meanwhile, cost discipline kept the cost-to-income ratio at near 24%. Strong fee income, bad-debt recoveries, and subsidiary earnings also reinforced the bank’s recovery momentum in 2025.
Sacombank

Sacombank is another key private-sector bank in Vietnam. The bank currently operates 560 branches not only in Vietnam, but also in Laos and Cambodia. Sacombank focuses on retail lending (mortgages, auto loans, etc.) and small and medium-sized enterprise (SME) lending.
Sacombank by The Numbers (2025):
- Revenue +11.8% to $1.2 billion
- Net Income $0.2 billion
- Net Interest Margin 3.2%
- Earnings pe Share $0.12
Sacombank recorded a +4% increase in operating income in the fourth quarter. Although the bank's net interest Income declined, Sacombank still managed to increase its revenue and net income thanks to a 42% reduction in operating expenses. The bank still recorded a loss of $106 million in the fourth quarter due to a sharp jump in provisioning expenses of $355 million.
Vietcombank

Originating as a specialized bank serving the country’s external economic activities, Vietcombank has evolved into a full-service, multi-functional financial institution. Today, it operates across a wide range of sectors, offering top-tier services in international trade and traditional banking activities such as capital management, fund mobilization, credit provision, and project financing, as well as modern banking services, including foreign exchange, derivatives, card services, and electronic banking. With a market capitalization of more than $20 billion, Vietcombank now ranks among the world’s 100 largest listed banks. Vietcombank operates an extensive network of more than 600 branches, 3,090 ATMs, 121,035 card payment acceptance units nationwide and 24,000 employees.
Vietcombank By The Numbers (2025):
- Revenue +27.4% to $0.4 billion
- Net Income +4.0% to $0.2 billion
- Net Interest Margin 2.7%
- Earnings per Share $0.09
2025 results were mostly in line with the market’s expectations. Vietcombank's credit growth was 15%, compared to Vietnam's overall credit growth, which was reported at 19%. Vietcombank's growth was driven slightly more by retail credit compared to corporate. Consumer credit increased by +18.5% versus only 13% for corporate credit. Net interest margin improved slightly in the fourth quarter , while its ratio of non-performing loans (NPLs) remains low compared to the industry average in Vietnam, at just 0.6%.
HD Bank

Established in 1990, HD Bank provides a wide array of financial and banking services to individuals, businesses and investors. The bank has a network of 347 banking transaction points and 22,921 financial transaction points, serving over 30 million customers in its ecosystem including airlines, supermarkets, telecommunications firms. Recently, HD Bank has focused on a strong digital transformation strategy across operations and client-facing activities.
HD Bank by The Numbers (2025):
- Revenue +25.4% to $1.6 billion
- Net Income +29.3% to $0.6 billion
- Net Interest Margin 4.4%
- Earnings per Share $0.13
HD Bank's net profit after taxes & minority interests (NPATMI) increased 64% to $200 million in the fourth quarter. Asset quality improved, lowering the number of NPLs as a percentage of total loans outstanding, and the growth of current accounts and savings accounts (CASAs) recovered to 12.4% from the 10% exhibited in the previous quarter. Credit grew by 31% YoY and 13% quarter-over-quarter thanks to strong corporate loan growth of 34% YoY and despite modest retail loan growth of 5% YoY.
FPT Corporation

FPT is a pioneer in Vietnam's digital transformation and a leader in IT consulting services, providing and deploying technology and telecommunications services and solutions. With 38 years of history, presence in 30 countries and almost 50,000 employees, FPT is the largest listed technology company in Vietnam.
FPT Corporation by the numbers (2025):
- Revenue +11.6% to $2.7 billion
- Net Income +19.3% to $0.4 billion
- Net Margin 16.0%
- Earnings per Share $0.20
Core IT services revenue increased +21% in the fourth quarter on increasing domestic and global demand for IT services. Meanwhile, the telecom segment exhibited slower growth of +9%, but saw better cost management and, as a result, improved profitability.
Gemadept

Gemadept is a large private port operator in Vietnam, owning ports nationwide across North, South and Central Vietnam. The Gemalink Deep-sea Port is ranked among the 19 ports in the world capable of receiving the largest vessels.
Gemadept by the numbers (2025):
- Revenue +23.1% to $0.2 billion
- Net Income +15.2% to $0.7 billion
- Net Margin 27.4%
- Earnings per Share $0.14
Fouirth quarter revenue increased 14.4% to $62 million, adding to total revenue of $230 million in 2025. Revenue from ports rose 12%, accounting for 89% of total sales, as logistics and other business lines revenue increased 35%. Total cargo volume recorded as having been handled by Gemdept's ports increased 17% to 3.1 million twenty-foot equivalent units (TEUs). The gross margin for 2025 improved to 46% from 44% in 2024.
Vinhomes

Vinhomes, a large residential property developer in Vietnam by market capitalization, had recorded $37 billion in cumulative contracted sales since 2010 as of October 2025, with presales outstanding of 285,700 residential units, approximately 517,000 residents across its properties nationwide, and 30 urban complexes developed.
Vinhomes By The Numbers (2025):
- Revenue +50.6% to $5.9B
- Net Income +29.3% to $1.6B
- Net Margin 27.3%
- Earnings per Share $0.06
Vinhomes delivered solid sales growth of +218% in the fourth quarter, booking $3.9 billion in net sales thanks to bulk sales at Vinhomes Green Paradise, unit deliveries at Ocean Park 2 & 3, and further sales at Vinhomes Royal Island. Fourth quarter net profit after tax and minority interests (NPATMI) rose +119.8% to $1 billion, while presales remain strong at $1.7 billion with contributions from Ocean Park 2, Golden City, Wonder City and other projects. Unbilled presales in Vinhomes Wonder City, Golden City, Ocean Park 2, Royal Island and Green City totalled $7.2 billion and are expected to be converted into revenues when the units are delivered.
Mobile World Group (MWG)

MWG is Vietnam’s leading multi-category retail platform by revenue and net income. The company operates thousands of stores nationwide across multiple chains which include thegioididong.com (a retail chain for mobile phones, laptops and accessories), Điện Máy Xanh (a consumer electronics retail chain) and Bách Hoá Xanh (chain of 2,559 modern groceries retail stores), among others.
MWG directly benefits from a clear structural shift underway from traditional trade toward modern retail formats, i.e. developed world-style supermarkets as opposed to open-air, multi-vendor markets. Modern trade penetration has increased from approximately 20% of total retail value in 2019 to around 27% in 2024, reflecting steady migration toward organized channels. This transition has been particularly evident in essential categories. In grocery retail, modern trade penetration rose from 9% to 13% over the same period, as consumers prioritized convenience, consistent product quality, and price transparency. At the same time, the growing importance of scale and logistics efficiency has reinforced the competitive advantages of organised retailers.
Mobile World by the numbers (2025)
- Revenue +16.5% to $6.0B
- Net Income +89.1% to $0.3B
- Net Margin 4.5%
- Earnings per Share $0.01
MWG exceeded profit expectations in the fourth quarter. DMX, which is a subsidiary consumer electronics chain, contributes 43.8% to total revenue, followed by BHX (grocery stores) at 30% and thegioididong (mobile phone stores) at 23.9%. After a period of restructuring, BHX saw 789 new stores opened in 2025, all of which have delivered positive operating profits and nearly 70% of the stores recorded positive EBIT. For 2026, MWG set target of +18% YoY growth in revenue and +30% growth in net profits.
Nam A Commercial Bank

Nam A Commercial Bank (NAB) officially commenced operations on October 21, 1992, and was one of the first commercial joint stock banks established after the Banking Ordinance was issued in 1990, which effectively allowed the development of a private banking system. NAB currently offers almost 280 transaction centres and employs more than 5,300 personnel. In 2025, NAB was included in the Southeast Asia 500 list by Fortune Magazine.
Nam A Commercial Bank by the numbers (2025):
- Revenue +27.4% to $0.4B
- Net Income +15.9% to $0.2B
- Net Interest Margin 2.7%
- Earnings per Share $0.09
NAB posted +57% top line growth for 2025 at $152 million, concluding the year with revenue growth of +27% to $444 million. NPATMI for the whole year saw growth of +16%, reaching $161 million in 2025. NAB reported a decrease in NPLs in the fourth quarter, down to 2% from 3% in the previous quarter. The NPL ratio for 2025 is at 2.2%, a slight improvement from 2.3% in 2024. CASA was at the highest level for 2025 in the fourth quarter at 6.1%. However, the CASA remained lower than the 6.6% reported in 2024.
This material is provided for informational purposes only and is not intended as investment advice or a recommendation to buy or sell any security or investment product. The companies referenced represent holdings of the ETF at a point in time and are subject to change. Inclusion of a security should not be construed as an endorsement or indication of future performance.
For KPHO standard performance, top 10 holdings, and other fund information, please click here.
*Diversification does not ensure a profit or guarantee against a loss. Diversification in this context is not regulatory diversification. KPHO is non-diversified. To the extent the Underlying Index is concentrated in a particular industry, the Fund is expected to be concentrated in that industry.
KPHO Top 10 Holdings As of Latest Month End & Latest Quarter End:
| Holding | Ticker | Weight (%) as of 1/31/2026 - Latest Month End |
|---|---|---|
| DCVFMVN DIAMOND ETF | FUEVFVND | 24.48 |
| Hoa Phat Group JSC | HPG | 7.71 |
| Vietnam Prosperity JSC Bank | VPB | 7.44 |
| Saigon Thuong Tin Commercial | STB | 4.94 |
| Bank for Foreign Trade JSC | VCB | 4.70 |
| HDBank | HDB | 4.43 |
| Gemadept Corp | GMD | 4.14 |
| Vinhomes JSC | VHM | 4.01 |
| Nam A Commercial JSB | NAB | 3.83 |
| VNDIRECT SECURITIES CORP | VND | 3.82 |
| Holding | Ticker | Weight (%) As of 12/31/2025 - Latest Quarter End |
|---|---|---|
| DCVFMVN DIAMOND ETF | FUEVFVND | 24.26 |
| Vietnamese dong | — | 18.18 |
| Vietnam Prosperity J S C Bank | VPB | 7.84 |
| Hoa Phat Group J S C | HPG | 7.82 |
| Vinhomes J S C | VHM | 4.83 |
| HDBank | HDB | 4.79 |
| Saigon Thuong Tin Commercial | STB | 4.68 |
| VNDirect Securities Corp | VND | 4.13 |
| Nam A Commercial J S B | NAB | 3.98 |
| Bank for Foreign Trade J S C | VCB | 3.95 |
Citations:
- Mai, Anh. “Vietnam Records 8.02% GDP Growth, Fastest in ASEAN.” Vietnam Business Forum, 29 Jan. 2026.
- Data from FactSet as of 1/30/2026.
Definitions:
Profit Before Tax (Net Profit): the amount a company earns after operating expenses, interest, and other costs are deducted, but before income taxes are applied.
Net Profit After Tax & Minority Interest (NPATMI): Profit remaining after all expenses, interest, and taxes are paid, and after deducting the share of profit attributable to minority (non‑controlling) shareholders; effectively the profit attributable to the parent company’s shareholders.
Non‑Performing Loans (NPLs): Loans on which the borrower is no longer making interest payments or repaying principal according to the contractual terms, commonly defined as loans that are 90 days or more past due or otherwise unlikely to be repaid in full.
CASA (current accounts and savings accounts): Funds placed with a bank (such as checking, savings, and term deposits) that the bank records as liabilities and typically uses to fund loans and investments, while paying interest or transaction services to depositors.
GDP (Gross Domestic Product): The total monetary value of all final goods and services produced within a country’s borders over a specific period (usually a year or quarter), used as a broad measure of the size and health of an economy.
P/E (Price‑to‑Earnings ratio): A valuation multiple calculated as a company’s current share price divided by its earnings per share, indicating how much investors are willing to pay today for one unit of current (or expected) earnings.
MSCI Emerging Markets Index: A free‑float‑adjusted, market‑capitalization‑weighted index that measures large‑ and mid‑cap equity performance across emerging‑market countries; it was launched on 30 June 1988 (MSCI EM Index, index ID 891800).msci+2
Gross Margin: The percentage of revenue remaining after deducting cost of goods sold, typically calculated as (Revenue−COGS)/Revenue(Revenue−COGS)/Revenue; it measures how efficiently a company produces or sources its goods or services.
Net margin (net profit margin): Net income divided by revenue, usually expressed as a percentage, showing how much of each unit of revenue becomes profit after all operating costs, interest, taxes, and other expenses.
Net interest margin (NIM): For banks and lenders, the difference between interest income earned on assets (like loans and securities) and interest expense paid on funding (like deposits and borrowings), divided by average interest‑earning assets; it measures the profitability of a financial institution’s core lending and investing activities.
EBIT (Earnings Before Interest and Taxes): A measure of operating profitability equal to revenue minus operating expenses (including COGS and operating overhead) but before deducting interest and income taxes; often used as a proxy for operating income.
FTSE Emerging Markets Index: A free‑float, market‑capitalization‑weighted index from FTSE Russell that tracks large‑ and mid‑cap stocks across emerging‑market countries; the FTSE Emerging Markets Index was launched on 30 June 2000 (base date 31 December 1986).
TEU (Twenty‑foot Equivalent Unit): A standard unit of cargo capacity based on the volume of a 20‑foot intermodal shipping container; widely used to measure capacity and throughput of container ships and ports
Revenue: The total amount of money a company earns from its normal business activities, such as selling goods or services, over a specific period, before deducting any expenses. It is often referred to as the “top line” because it appears at the top of the income statement.
Net income: The profit that remains after all expenses, including operating costs, interest, taxes, and any other charges, have been subtracted from total revenue. This figure is sometimes called the “bottom line” because it shows the final profit attributable to shareholders.
Revenue growth: The percentage change in a company’s revenue from one period to the next. It is typically calculated as (current period revenue−prior period revenue)/prior period revenue(current period revenue−prior period revenue)/prior period revenue and measures how quickly sales are expanding or contracting over time.
EPS (earnings per share): A profitability metric calculated by dividing a company’s net income attributable to common shareholders by the weighted‑average number of common shares outstanding over a period. It indicates how much profit the company generates for each individual share of stock.
Cost-to-Income Ratio: A key financial metric measuring operational efficiency, calculated by dividing a company's operating costs by its operating income.