
AGIX Report Card: Does Private Stock Exposure Contribute To ETF Performance?
By  Cole Wenner
For the KraneShares Artificial Intelligence and Technology ETF (Ticker: AGIX), the answer is yes. Let’s dive into the numbers.
Global exchange-traded funds (ETFs) have added 5 trillion in assets in 2025 alongside a wave of innovation1, including strategies that blend public and private exposure in a single, exchange-traded wrapper.
These strategies are called "hybrid" or "public-private" ETFs, and we believe how these products are built may influence their effectiveness.
KraneShares partnered with Etna Capital Management, founded by AI‑native engineers and investors that are embedded in today’s AI ecosystem, to launch a hybrid AI ETF, the KraneShares Artificial Intelligence and Technology ETF (Ticker: AGIX). We believe that having an AI-aware sub-advisor like Etna, who worked in the industry themselves and maintains relationships with select private innovators, is the basis for creating a public-private ETF.
AGIX Public and Private Performance Review
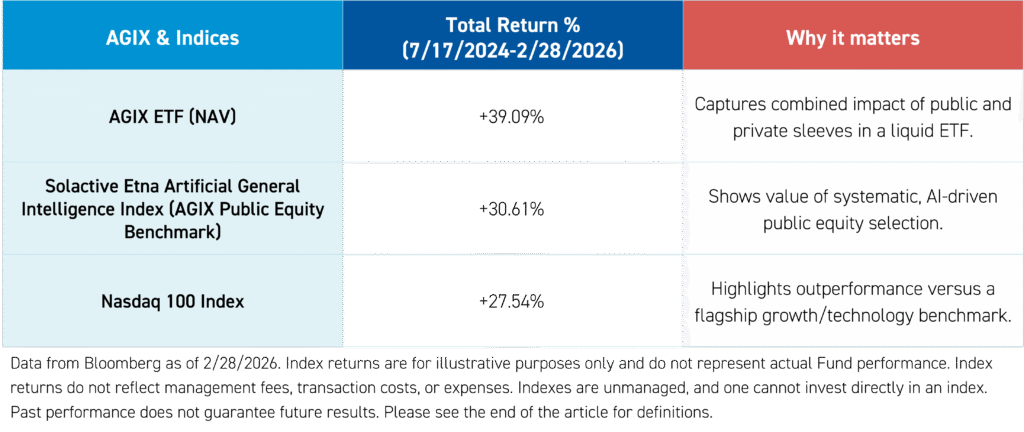
First, let's look at AGIX’s public equity benchmark, which we believe is arguably the most important slice of the portfolio since it accounts for over 85% of its holdings. AGIX tracks the Solactive Etna Artificial General Intelligence Index, which uses a proprietary AI Exposure Score engineered by Etna Capital Management to select companies across AI hardware, infrastructure, and applications.
Unlike some “AI beta” funds with significant broad tech exposure, AGIX’s index is specifically designed to target companies with measurable AI impact. Additionally, AGIX launched in July 2024, just as the generative AI landscape shifted from early experimentation to scaled deployment, with new frontier models like Meta’s Llama 3.1 and OpenAI’s GPT‑4o mini launching that month as well.2 AGIX was built for this new-age phase of the AI cycle, using an AI‑specific index to target companies with material AI exposure while complementing them with direct stakes in select private AI companies.
Since AGIX's inception (7/17/2024–2/28/2026), its public equity index has returned +30.61%, outpacing the Nasdaq-100 Index’s +27.54% gain over the same period.3 This public‑side outperformance versus a widely recognized technology growth benchmark matters because it shows that the “core” of the portfolio, the part investors are exposed to every day and drives most of the risk, has added value.
But what about AGIX’s private allocation?
AGIX’s total net asset value (NAV) return since inception is +39.09%, and 21.69%* of the fund's performance can be attributed to its private allocation.3 This was achieved by allocating less than 15% of AGIX's assets to select private companies, including Anthropic and SpaceX.3 Put differently, the private sleeve has amplified the value created by the public sleeve, contributing to a total outperformance of +11.55% versus the Nasdaq-100 Index over the same period.3
The performance data quoted represents past performance. Past performance does not guarantee future results. The investment return and principal value of an investment will fluctuate so that an investor’s shares, when redeemed or sold, may be worth more or less than the original cost. Current performance may be lower or higher than the performance quoted. For performance data current to the most recent month end, please visit AGIX.
For investors, this gap helps illustrate why the structure and execution of a hybrid ETF matter: the incremental return attributed to private exposure is potentially what investors expect to earn in exchange for taking on less liquid exposures.
Other notable indices AGIX has outperformed (7/17/2024–2/28/2026)3:
- S&P 500 Index (Broad-based U.S. equities): +25.62%
- Technology Select Sector Total Return Index (Technology-focused index): +25.06%
These statistics are not just “nice to have”; they help answer two key questions for any hybrid ETF: Is the public sleeve pulling its weight, and is the private sleeve adding differentiated value on top of that core? In AGIX’s case, so far, the data suggests the answer to both is yes.
What makes AGIX’s approach different?
Hybrid and public‑private ETFs seek to offer daily liquidity plus access to select private companies. Still, in practice, many structures keep investors at arm’s length, using special purpose vehicles (SPVs) or pooled vehicles that add fees, blur ownership, and potentially dilute the very return stream investors came for. In that setup, “hybrid” can read more like a label rather than a source of potential excess return.
AGIX was built differently. The fund starts with an index‑based public core that has outpaced a major technology benchmark since launch, then layers a focused set of directly held private AI innovators, such as Anthropic and SpaceX, on top of that base. Direct, capitalization table ownership helps keep the link between company value creation and shareholder experience as clean as possible, supported by a documented, committee‑driven valuation process.**
The result is not just a different structure, but a different outcome: since inception, AGIX has exceeded its public equity benchmark by a meaningful margin, with private holdings acting as a real driver of value rather than a marketing feature.
For investors, the current takeaway from the data is clear: when evaluating hybrid ETFs, the questions should not stop at “Does it own private names?” but extend to “How does it own them, how is the public sleeve constructed, and have those design choices actually shown up in performance so far?”
For AGIX standard performance, top 10 holdings, risks, and other fund information, please click here.
Holdings are subject to change.
*Any portion of the Fund’s returns attributed to investments in private companies reflects changes in the estimated value of those holdings, which are inherently subjective, depend on valuation assumptions, may differ materially from realized outcomes, and are not indicative of future performance.
**Investments in private companies are valued using estimates based on available information and judgment, including assumptions that may change over time; such valuations are inherently subjective, may be affected by limited liquidity, and may differ materially from realized outcomes.
Citations:
- Data from "Assets in the global ETF industry hit record USD19.85 trillion in 2025," ETF Express, as of 1/21/2026.
- Data from Meta & OpenAI company websites as of July 2024.
- Data from Bloomberg as of 2/28/2026. AGIX complies with SEC Rule 22e-4, which limits investments in illiquid assets—including private companies—to 15% of net assets to support daily liquidity and retail suitability.
Index Definitions:
Nasdaq-100 Index: The Nasdaq-100 tracks the performance of 100 of the largest and most actively traded stocks on the Nasdaq exchange, with a technology sector focus.
Solactive Etna Artificial General Intelligence Index: The index captures the performance of global securities with significant business exposure to AI. This includes companies active in the provision of AI Hardware, AI Infrastructure and AI Applications. The index serves as the public equity benchmark for the KraneShares Artificial Intelligence and Technology ETF (Ticker: AGIX).
S&P 500 Index: A market-capitalization-weighted index that tracks the performance of approximately 500 of the largest publicly traded companies across all major sectors of the U.S. economy.
Technology Select Sector Total Return Index: A market-capitalization-weighted index that measures the performance, including reinvested dividends, of S&P 500 companies classified in the technology-related industries such as software, hardware, semiconductors, and IT services.
Definitions:
Capitalization Table: A record of a company’s owners and their ownership percentages, showing how equity is distributed among shareholders and investors.
Special Purpose Vehicle: A separate legal entity created for a specific investment purpose, often used to hold a single private investment or group of assets.
Net Asset Value: The per-share value of an ETF, calculated by taking the total market value of its underlying holdings minus liabilities and dividing by the number of ETF shares outstanding, providing a daily benchmark for the fund’s fair value.