April 11, 2024 – Talk Your Book: Building Confidence in China Equity Investing
April 9, 2024 – Many Investors Are More Exposed to China Than They Think, Says Brendan Ahern

April 2, 2024 – Emerging Markets ‘Well-Positioned’ for Growth: Strategist

March 28, 2024 – China’s BYD Has ‘Superior Manufacturing and Vertical Integration,’ Strategist Says
Our semi-monthly topical research reports. Subscribe to our weekly mailing list for more.
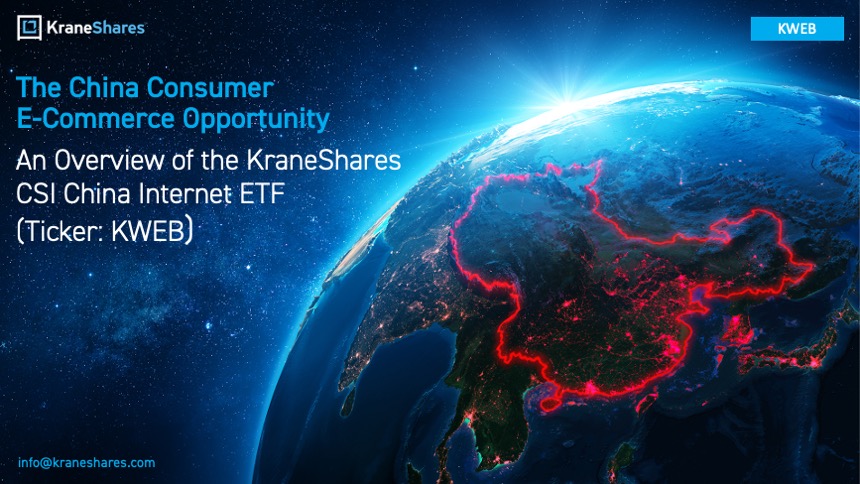
KWEB tracks the CSI Overseas China Internet Index, which consists of China based companies whose primary business or businesses are focused on internet and internet-related technology. The Index is free float market capitalization weighted and includes publicly traded securities on either the Hong Kong Stock Exchange, NASDAQ Stock Market, or New York Stock Exchange.
1. The State Council, the People’s Republic of China. Note: Figures converted from Chinese Renminbi to USD as of 3/31/2022. Retrieved on 12/31/2023.
2. Data from U.S. Department of Commerce as of 12/31/2022. Retrieved on 12/31/2023.
3. Data from Statista and The World Bank as of 12/31/2022. Retrieved 12/31/2023.
Essential metals (#copper, #nickel, #aluminum, #zinc, #cobalt, & #lithium) are crucial for the $140 trillion global #energytransition, but prices have dipped from 2022 highs. This presents a potential #investment opportunity for the KraneShares Electrification Metals Strategy ETF… pic.twitter.com/eirn3E5FD4
— KraneShares (@KraneShares) March 28, 2024
Defined outcome strategies are growing in popularity. Until now, they have historically focused on #US #equities, but when applied to the right #market at the right time, they can potentially yield outsized risk-adjusted results. Read our latest article to learn more about the… pic.twitter.com/M7FJjAF8d3
— KraneShares (@KraneShares) March 25, 2024


The Growth of $10,000 chart reflects an initial investment of $10,000 on the day prior to the selected time period and assumes reinvestment of dividends and capital gains. For the growth of $10,000 chart since inception, the initial investment of $10,000 is instead made on the inception date of the Fund. Fund expenses, including management fees and other expenses were deducted. The growth of a $10,000 investment in the fund is hypothetical and for illustration purposes only. Fund performance data used in this chart is based on Fund NAV and represents past performance. Past performance does not guarantee future results.
| Rank | Name | % of Net Assets | Ticker | Identifier | Shares Held | Market Value($) |
| 1 | TENCENT HOLDINGS LTD | 9.90% | 700 | KYG875721634 | 13,457,875 | 516,906,678 |
| 2 | ALIBABA GROUP HOLDING LTD | 8.92% | 9988 | KYG017191142 | 53,649,464 | 465,835,005 |
| 3 | MEITUAN-CLASS B | 8.22% | 3690 | KYG596691041 | 34,471,348 | 429,381,526 |
| 4 | PDD HOLDINGS INC | 6.56% | PDD | US7223041028 | 3,020,468 | 342,611,685 |
| 5 | TRIP.COM GROUP LTD | 6.01% | 9961 | KYG9066F1019 | 6,419,500 | 313,948,056 |
| 6 | NETEASE INC | 5.31% | 9999 | KYG6427A1022 | 15,401,105 | 277,483,214 |
| 7 | KANZHUN LTD - ADR | 4.81% | BZ | US48553T1060 | 13,876,130 | 251,296,714 |
| 8 | TENCENT MUSI-ADR | 4.69% | TME | US88034P1093 | 21,748,098 | 245,101,064 |
| 9 | FULL TRUCK A-ADR | 4.48% | YMM | US35969L1089 | 30,962,155 | 234,073,892 |
| 10 | JD.COM INC-CLASS A | 3.99% | 9618 | KYG8208B1014 | 16,548,390 | 208,665,513 |
Holdings are subject to change.
| Name | Ticker | Listed Location | % of Net Assets | Combined % of Net Assets |
| ALIBABA GRP-ADR | BABA | United States | 0.00% | 8.92% |
| ALIBABA GROUP HOLDING LTD | 9988 | Hong Kong | 8.92% | |
| TRIP.COM GROUP LTD-ADR | TCOM | United States | 0.00% | 6.01% |
| TRIP.COM GROUP LTD | 9961 | Hong Kong | 6.01% | |
| NETEASE INC-ADR | NTES | United States | 0.00% | 5.31% |
| NETEASE INC | 9999 | Hong Kong | 5.31% | |
| JD.COM INC-ADR | JD | United States | 0.00% | 3.99% |
| JD.COM INC-CLASS A | 9618 | Hong Kong | 3.99% | |
| BAIDU INC - SPON ADR | BIDU | United States | 0.00% | 3.46% |
| BAIDU INC-CLASS A | 9888 | Hong Kong | 3.46% | |
| BILIBILI INC-ADR | BILI | United States | 0.00% | 1.93% |
| BILIBILI INC-CLASS Z | 9626 | Hong Kong | 1.93% | |
| Many US-listed Chinese companies also have listings in Hong Kong, called "secondary listings". KWEB seeks to provide investors with optimal exposure to the US and Hong Kong listed versions of these securities. In the table above, we display the individual and combined impact of US and secondary listings on the Fund. | ||||
| Hong Kong | 62.3% | |
| United States | 36.2% | |
| Anticipated US to HK Relisting | 1.5% |
| Hong Kong | 66.6% | |
| United States | 33.4% |
Hyperlinks on this website are provided as a convenience and we disclaim any responsibility for information, services or products found on the websites linked hereto.
Click here to continueYou are now leaving KraneShares.com. Hyperlinks on these websites are provided as a convenience and we disclaim any responsibility for information, services or products found on the websites linked hereto.